Student Engagement Metrics
This article explains the Student Engagement Metrics used in Jisc learning analytics.
All students with active modules have metrics produced against them. Metrics are recalculated each weekday night. Each metric is calculated into a percentage which results in a RAG (Red, Amber, Green) rating based on thresholds which Sheffield Hallam have set institutionally. Active modules are modules that are currently running and are set in Jisc learning analytics system based on module start and end dates in SITS. If your module start and end dates are incorrect, please contact ! SITS Help.
Students have a summary metric and metrics for each area of engagement (attendance, Blackboard use, and Blackboard submissions).
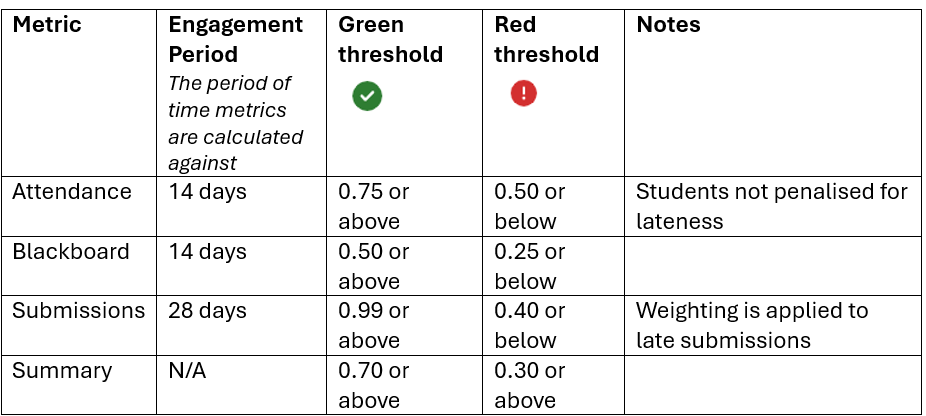
- Attendance metrics are calculated based on the past 14 days of attendance data. This is a personalised metric calculated based on the student's actual attendance to expected attendance.
- Blackboard (VLE) use metrics are calculated based on the past 14 days of Blackboard use. This is a centile value comparing the student's use to that of the module cohort.
- Submission metrics are calculated based on the past 28 days from Blackboard Grade Book. This is a personalised metric designed to highlight late and non-submissions. These are not ratified marks.
- Summary metric is a normalised calculation based on the student's attendance, Blackboard use, and Blackboard submissions.
Based on the thresholds, where students are flagged as low engagement in Jisc learning analytics system, the Student Success & Engagement Team conduct proactive support interventions.
Student Engagement Metrics Explained
- Students with active modules will have metrics produced against them.
- Submission metrics (taken from Blackboard Grade Book) will be produced regardless of the module being active. This is because submissions / non-submissions are significant indicators.
- Metrics are calculated following the ingest of data (weekdays at 22:00).
- RAG (Red, Amber, Green) ratings are numeric in the range of 0 – 100% and set against thresholds. Thresholds are configurable (see below table). RAG rating is supplied for all metrics, except ‘days since last activity’.
Metric Thresholds
Below are the metric thresholds set at an institutional level for Sheffield Hallam. The metrics are based on Attendance, Blackboard, and Submissions, as defined above.
Attendance
- Metric for attendance are personalised. Each student’s attendance percentage is calculated individually comparing what each student attended against what they are expected to attend.
- Sheffield Hallam attendance metric calculations look over the past 14 days.
- As the above table displays, students at .75 attendance or above will show a ‘Green’ RAG rating for attendance.
Blackboard usage
- Metric Blackboard usage compares each student to the performance of the module cohort. The module cohort comparison is taken from a centile value. A centile is a value below which a given percentage of counts fall. (e.g., 90th centile would be a value that 90% of the counts in the dataset fall below).
- Sheffield Hallam VLE usage calculations look over the past 14 days.
- As the above table displays, students at .50 centile or above will show a ‘Green’ RAG rating for VLE usage.
Submissions
- Metric for submissions uses assignment submissions from Blackboard Grade Book. The metric is returned in range of 0 – 1 and has been designed to highlight non-submissions. The calculation is = (on time + (late * weighting))/assignments due.
- Submissions can be: On time or early (= 1); Late (= .5); or Missed (= 0)
- Sheffield Hallam submissions calculations look over the past 28 days.
- As the above table displays, .99 or above will show a ‘Green’ RAG rating for submissions.
Student Summary Metric
- The thresholds for each engagement type (attendance, Blackboard usage, submissions) are normalised to combine into an overall metric (Student Summary Metric).
- As the table above highlights, Sheffield Hallam have set different percentages for RAG ratings. Therefore, the percentages are normalised to produce the Student Summary Metric.
- As the above table displays, 0.70 or above will show ‘Green’ RAG rating for Student Summary.