Monitor Specific Module
This article explains how you can monitor student attendance and engagement for a specific module.
When you login to Jisc learning analytics, click Modules in the side menu. You will be presented with the Modules Page. To view an individual module page, click on the Module Instance ID in your list.
Module Page Details
The module page displays basic information about the module across the top of the screen. This includes:
- Module ID.
- Module Instance ID.
- The number of students enrolled on the module.
- The start date of the module – this data comes from SITS.
- The end date of the module – this data comes from SITS.
- The Status of the module – either Active or Inactive, dependent on start and end dates of the module.
- Total events - the number of timetabled events and the number of registers created in Jisc against this module.
- Events with no participation - the total number of events where registers had zero students marked as attended.
You can use the filters to select a specific date or a period of time.
Different Visualisations
You can view module engagement date using the Attendance grid, Attendance % by students, Attendance % by event, and Student engagement. These are explained below.
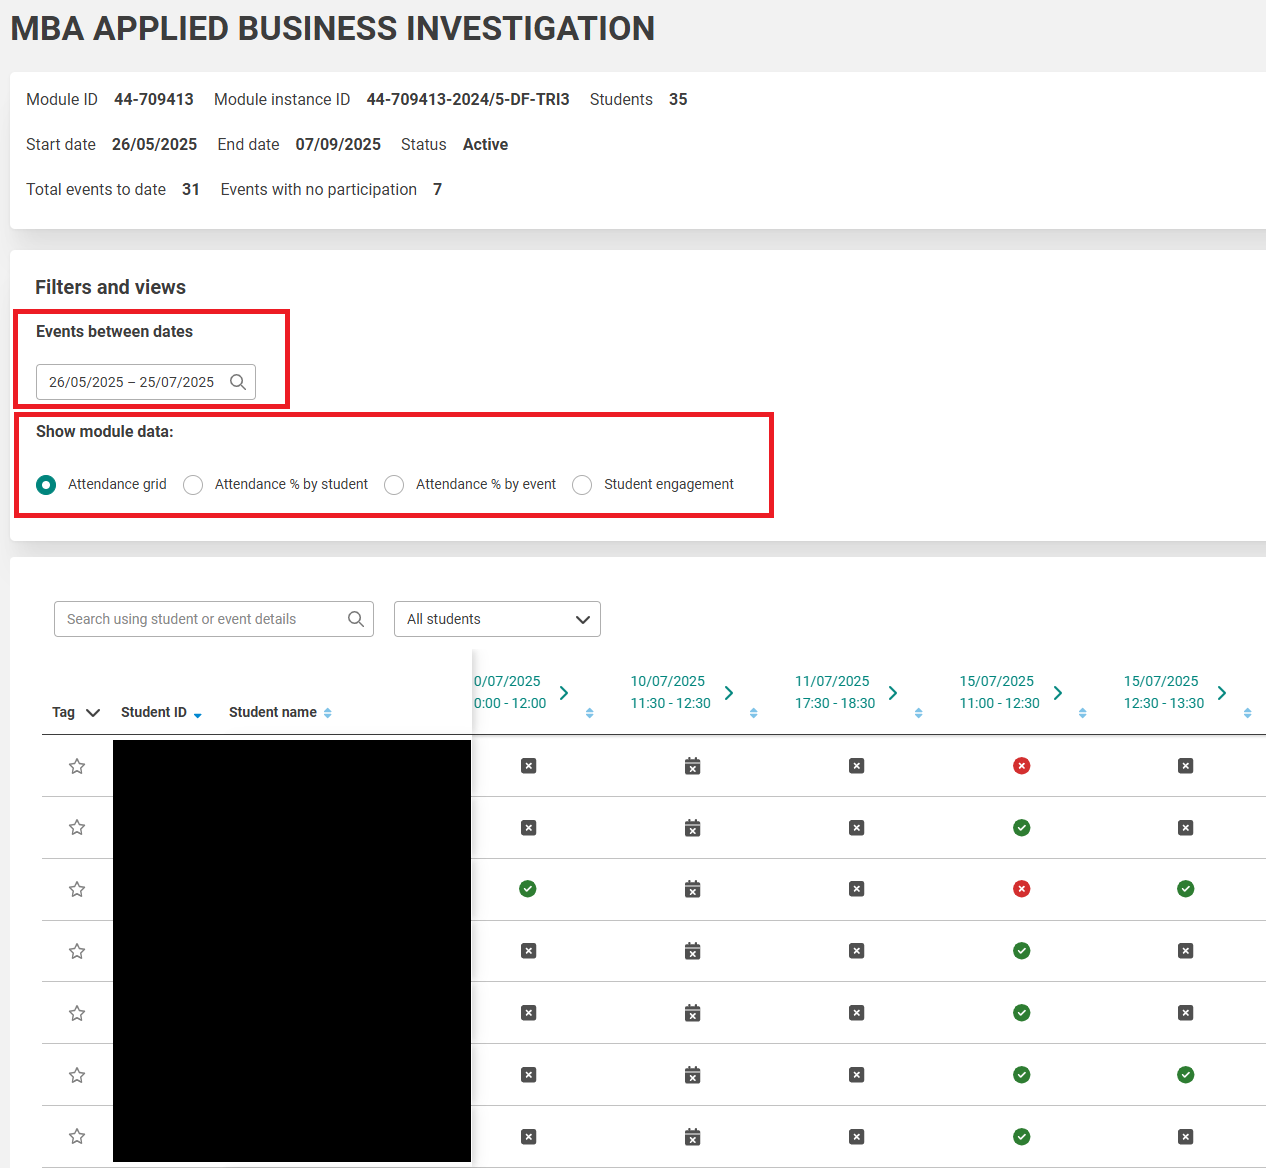
Attendance Grid
The attendance grid displays an overview of attendance by students and events, with an overall percentage of attendance per student.
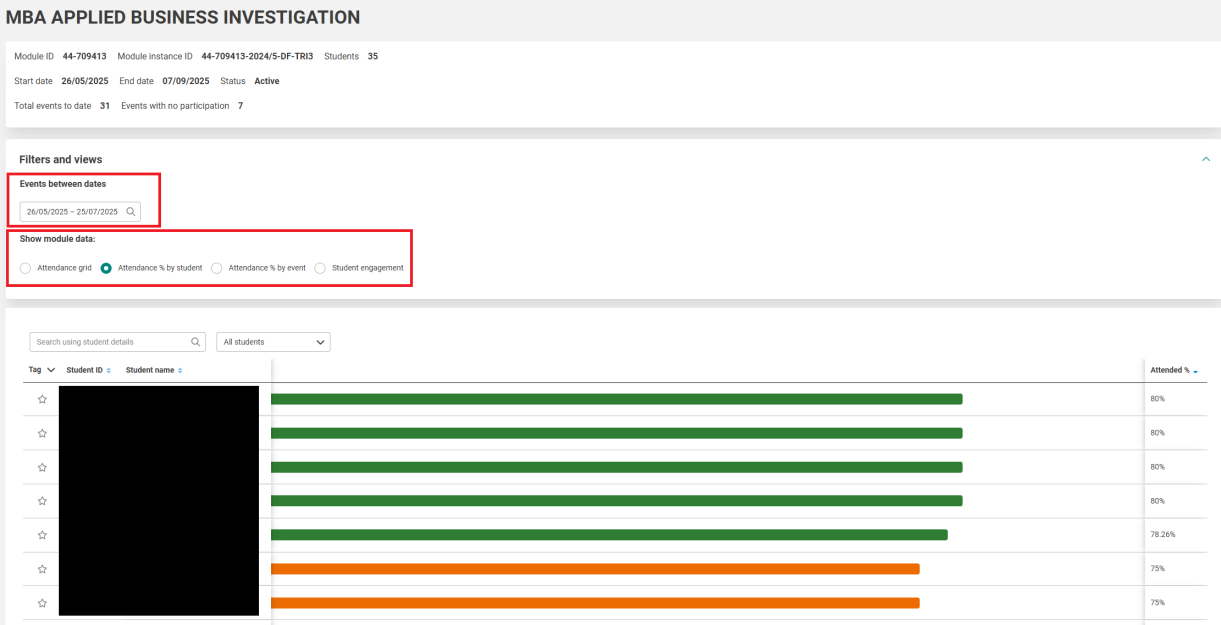
Attendance % by Students
The attendance % by students displays the attendance for each student enrolled on the module. This is a number of events the student attended divided by the number of events they were due to attend. A 'Not Required' attendance type is not included in the attendance % calculation.
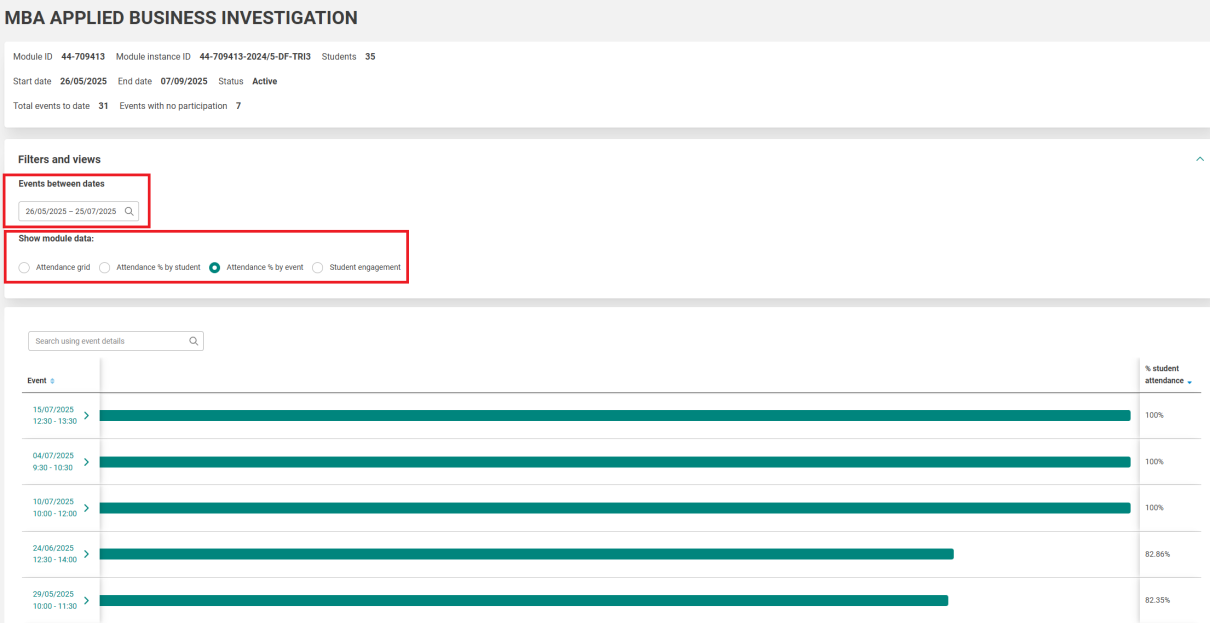
Attendance % by Event
The attendance % by event displays the attendance for each event register for this module. This is the number of students that attended the event divided by the number of students on the register to attend.
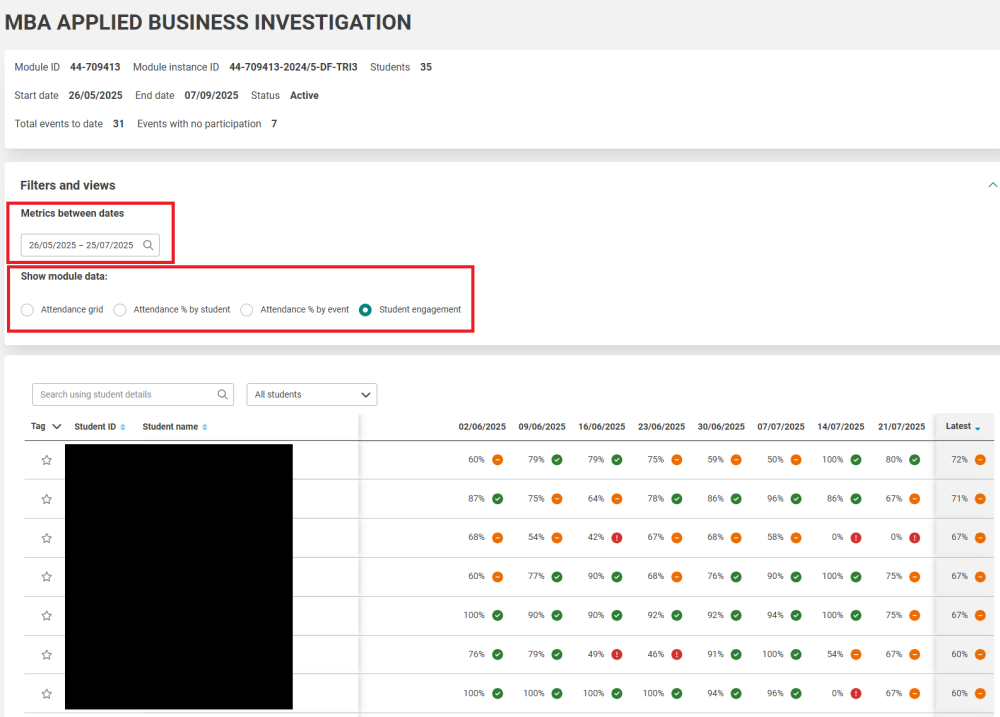
Student Engagement
The student engagement table displays the overall engagement for each student over a period of time for just this module. This includes their attendance for this module, their Blackboard use for this module, and their submissions. Engagement is taken once per week and populated on this table. Please refer to the article about how Student Engagement Metrics are calculated for further information.