Accessibility in STEM
Introduction
People with disabilities constitute 10% of the general workforce but only 2% of STEM professionals (Moon et al., 2012). The technical nature of STEM information can cause additional issues when it comes to presenting accessible information and often require specialist handling.
Graphs, Diagrams and other Technical Images
STEM images are often complex graphics, such as charts, diagrams, and mathematics notation. These kinds of images require both alternative text and long descriptions. Limit an alternative text description to 125-150 characters (one to two sentences), which is sufficient for most images. If a more detailed explanation is required, a long description also needs to be provided.
For example, consider the following diagram.
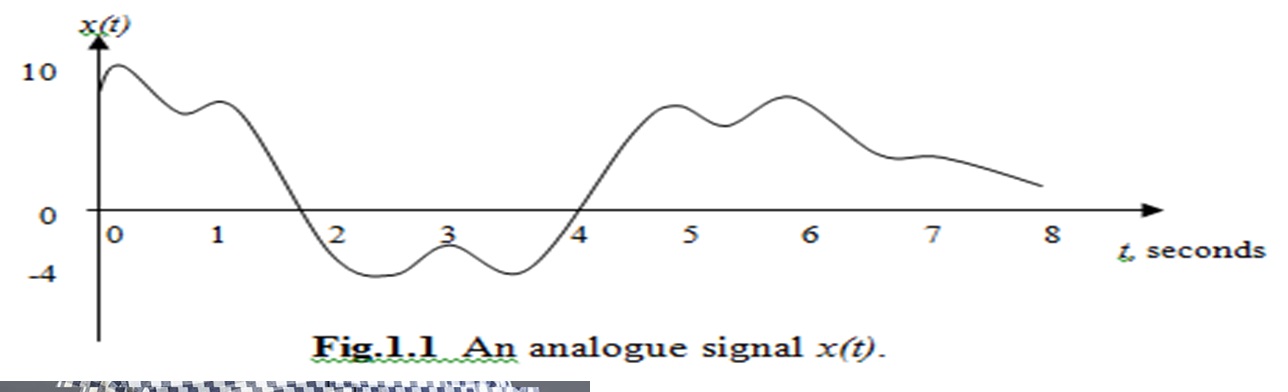
The alt text for the image should be a quick description of what the image is. For example, suitable alt text in this case would be:
"A graph showing the relationship between signal strength and time of an analogue signal"
The long description on the other hand should be a complete description of the contents of the image (as opposed to a description of what the image represents.) For example, a suitable long description would be:
"A graph showing the relationship between signal strength and time of an analogue signal. The y axis runs from -4 to 10 while the x axis runs from 0 seconds to eight seconds. The line moves downwards from zero with a local minimum of around seven just before one second then rises to a local maximum of around eight just after one second. It fall smoothly to a minimum of -4 at around 2.5 seconds, rises to a local maximum of around -2 at three seconds then falls again to a minimum of -4 at around 3.5 seconds. From there it rises to a local maximum of around 7 just before five seconds, descends to around 6 just after five seconds then rises again to around 7.5 just before six seconds. Finally it drops at a relatively constant rate, with a slight flattening at around seven seconds, to be around one at eight seconds."
Code
Examples of code can be useful in many subject areas and many areas similarly require code to be submitted for assessment, but can provide particular accessibility problems.
First, screen readers and other accessibility software is usually not configured for reading or writing code and doing so often requires "workarounds". As such, enforcing particular layout or style requirements could be particularly problematic for users of this type of software. You should not enforce specific code layout standards and instead rely on code formatting software if there is a requirement for a specific layout.
Care should be taken with abbreviations and particular abbreviation systems should not be enforced. Most modern IDEs will provide the type of a variable and so variable-type prefixes (strName) are unlikely to be needed. However, many common abbreviations ("btn" for "button") can cause problems in that the former would be pronounced "Bee Tee En" by a screenreader while the latter would be read "button" as normal - this means that many common abbreviations are actually longer for a screenreader and so should not be enforced.
Screen reading software also regularly skips duplicate characters, particularly punctuation. This can cause problems with constructions such as i++ or long chains of closing brackets. Alternative forms such as foo=foo+1 should be accepted and test questions involving such elements may require special attention.
Care should be taken with syntactic highlighting and contrast. In this example:
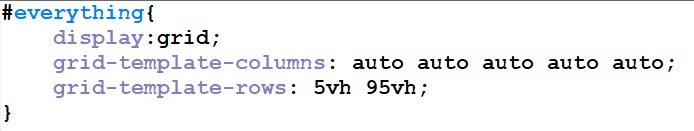
there is sufficient contrast between each individual colour and the white background but not enough contrast between the blue used for "everything" and the purple used for, for example "display". You can use Venngage to create colour palettes with suitable contrast or Adobe provides a similar tool that works well for handling colour blind users.
Excel
Many STEM subjects make extensive use of Excel and Excel often falls outside traditional accessibility guidance.
Referring to cells and cell ranges can be difficult and confusing for all users and users of assistive technology can face additional problems in this area. As a result you should ensure that all cells and ranges referenced in formulae are named as "=Weeks*Weekly_Amount" is easier to deal with than "=C4*C5" with the attendant backtracking to confirm the contents of those two cells. For a similar reason, tables of data should be identified as tables (using the Insert | Table command) - this also makes other basic functions considerably easier.
Cells should not be merged as it makes navigation and cell references harder to handle with assistive technology.
The flow of information should be left to right on each worksheets and left to right on worksheets - this means that cells should never depend on cells to the right of them for their information and a given worksheet should never rely on information from a worksheet to its right. Many types of assistive technology will "scan" from left to right and having to break that process can cause delays and errors.
"Summary" tables and other important information should have cell borders set, this will signal to users that it is important, standalone information that should be prioritised.